3. Results
3.1 Model Performance
Five ML models (2.2 Methods) were assessed on their Test and Cross-Validation (CV) Accuracies. The highest performing algorithm was XGB, with 79% and 80% for Test and Cross-Validation Accuracies respectively. The second best performing algorithm was SVM, producing Test and CV Accuracies of 70% and 80% respectively, followed by LOR which exhibited similar performance with 70% Test and 78% CV Accuracies. The fourth model, LDA, produced the results with 73% and 74% for Test and CV Accuracies respectively. SGD, the final model that was assessed, produced a Test Accuracy of 63% and CV Accuracy of 71%.
Figure 1. Test and Cross-Validation Accuracies of ML Algorithms.
Optimal hyperparameters and detailed performance
XGB's highest performance of 79% (Test Accuracy) and 80% (Cross-Validation Accuracy) was attained with the following hyperparameters:
learning_rate = 0.1,
n_estimators = 29,
max_depth= 5,
min_child_weight= 5,
gamma = 0.05,
subsample = 0.8,
colsample_bytree = 0.8,
nthread = 4,
scale_pos_weight = 1,
silent = 1,
objective = "multi:softprob",
num_class = 5
Additional information about the algorithm's performance:

SVM's highest performance of 70% (Test Accuracy) and 80% (Cross-Validation Accuracy) was achieved by implementing the following hyperparameters:
kernel = "linear",
C = 1
Additional information about the algorithm's performance:
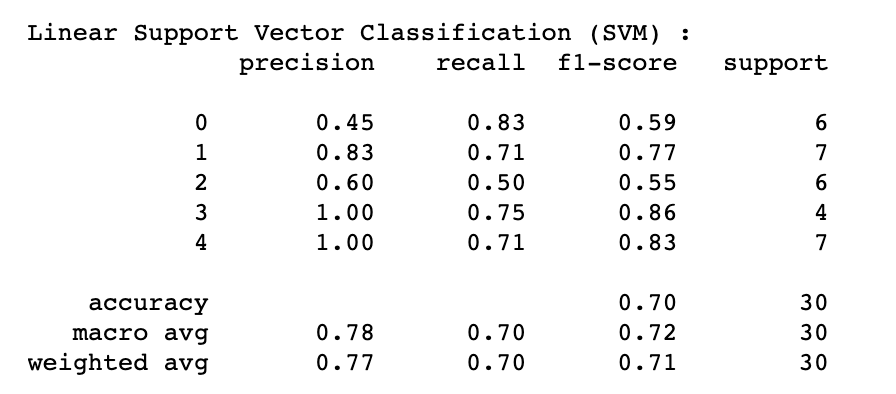
where labels "0" - Control group, "1" - AD Lesional, "2" - AD non-lesional, "3" - PSO lesional, "4" - PSO non-lesional
LOR's highest performance of 70% (Test Accuracy) and 78% (Cross-Validation Accuracy) was achieved by implementing the following hyperparameters:
C = 10,
penalty = "L2",
max_iter = 2000
Additional information about the algorithm's performance:
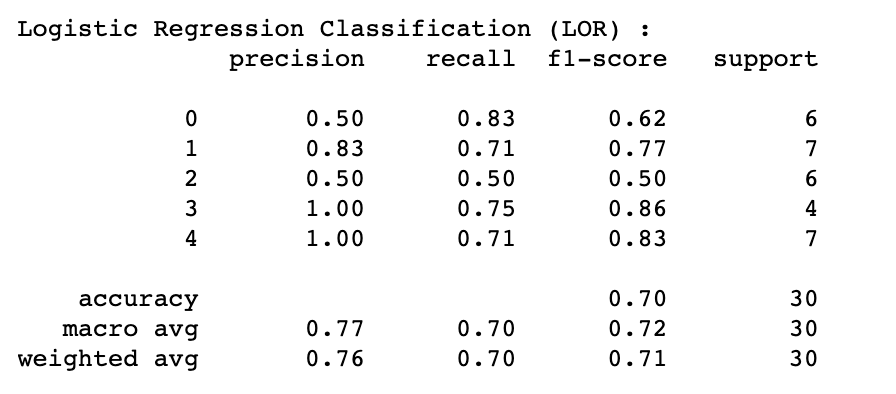
where labels "0" - Control group, "1" - AD Lesional, "2" - AD non-lesional, "3" - PSO lesional, "4" - PSO non-lesional
LDA's highest performance of 73% (Test Accuracy) and 74% (Cross-Validation Accuracy) was achieved by implementing the following hyperparameters:
solver = "svd"
Additional information about the algorithm's performance:
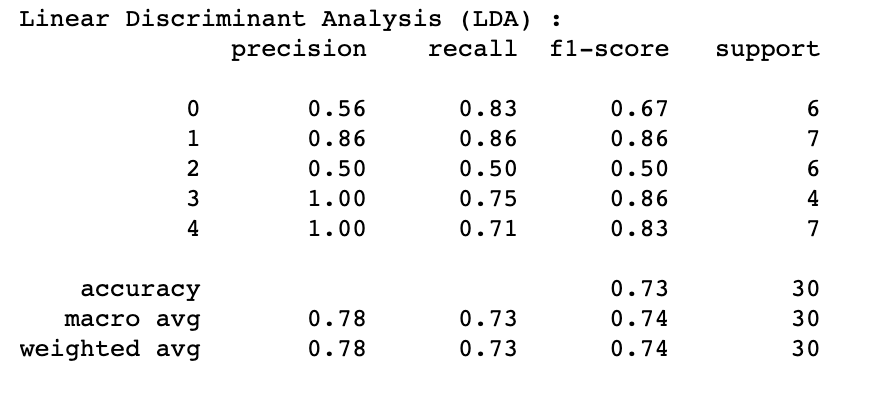
where labels "0" - Control group, "1" - AD Lesional, "2" - AD non-lesional, "3" - PSO lesional, "4" - PSO non-lesional
SGD's highest performance of 63% (Test Accuracy) and 71% (Cross-Validation Accuracy) was achieved by implementing the following hyperparameters:
loss="hinge",
penalty="elasticnet",
max_iter= 100,
alpha = 0.01
Additional information about the algorithm's performance:
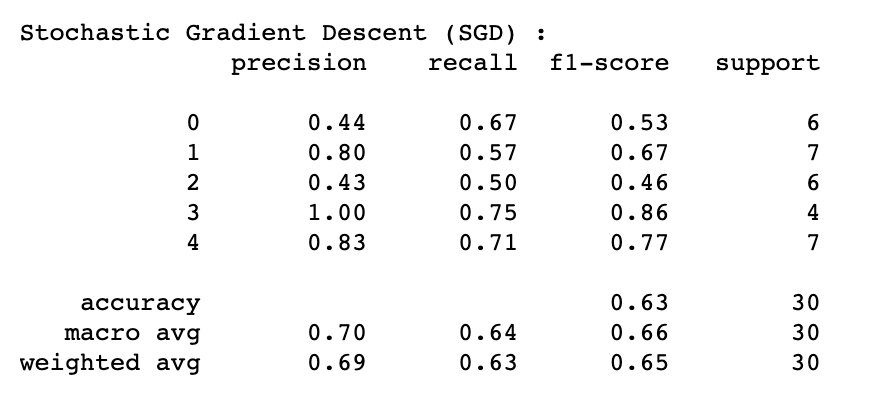
where labels "0" = Control group, "1" = AD lesional, "2" = AD non-lesional, "3" = PSO lesional, "4" = PSO non-lesional
After assessing the performance of the four models (LOR, LDA, SGD and SVM) which produce coefficients (reported later in 3.2 Coefficients and feature importance), it became apparent that LDA outperformed other algorithms for both AD lesional (86% across precision, recall, F1-score) and control group analysis (56% precision, 83% recall and 67% F1-score). For distinguishing AD non-lesional patients, SVM was found to be the best performing algorithm (60% precision, 50% recall and 55% F1-score). It is important to note that compared to other conditions, AD non-lesional was hard to differentiate and did not perform as well. SVM, LOR and LDA's performance were consistent (100% precision, 71% recall and 83% F1-score) for the PSO patients (both lesional and non-lesional), making the PSO's classifiers the most accurate by comparison.
| Sample type | Best performing algorithm |
|---|---|
| AD lesional | LDA |
| AD non-lesional | SVM |
| PSO lesional | SVM/LOR/LDA |
| PSO non-lesional | SVM/LOR/LDA |
| Control group | LDA |
3.2 Coefficients and feature importance
LOR, LDA, SGD and SVM algorithms all output coefficients in their results; these coefficients were used to evaluate the importance of each gene in contributing to each condition.
The XGB algorithm produces feature importance data as its key output. These are the weightings allocated to all genes across all groups, indicating the most important features (genes) overall for each condition.
3.2.1 Coefficients
Support Vector Machine (SVM) coefficients
Genes
Figure 2. SVM coefficients for AD lesional.
Genes
Figure 3. SVM coefficients for AD non-lesional.
Genes
Figure 4. SVM coefficients for PSO lesional.
Genes
Figure 5. SVM coefficients for PSO non-lesional.
Genes
Figure 6. SVM coefficients for control group.
Logistic Regression (LOR) coefficients
Genes
Figure 7. LOR coefficients for AD lesional.
Genes
Figure 8. LOR coefficients for AD non-lesional.
Genes
Figure 9. LOR coefficients for PSO lesional.
Genes
Figure 10. LOR coefficients for PSO non-lesional.
Genes
Figure 11. LOR coefficients for control group.
Linear Discriminant Analysis (LDA) coefficients
Genes
Figure 12. LDA coefficients for AD lesional.
Genes
Figure 13. LDA coefficients for AD non-lesional.
Genes
Figure 14. LDA coefficients for PSO lesional.
Genes
Figure 15 LDA coefficients for PSO non-lesional.
Genes
Figure 16. LDA coefficients for control group.
Stochastic Gradient Descent (SGD) coefficients
Genes
Figure 17. SGD coefficients for AD lesional.
Genes
Figure 18. SGD coefficients AD non-lesional.
Genes
Figure 19. SGD coefficients PSO-lesional.
Genes
Figure 20. SGD coefficients PSO non-lesional.
Genes
Figure 22. SGD coefficients control group.
3.2.1 Feature importance
In contrast to the four coefficient generating models discussed above, XGB provides insight into the most important genes overall for AD lesional, AD non-lesional, PSO lesional, PSO non-lesional and Control group patients.
Genes
Figure 23. XGB feature importance.
3.3 Identifying Signature Genes
3.3.1 AD lesional
Following on from the identification of LDA as the best performing algorithm for the AD lesional condition (see 3.1 Model performance), its top 50 genes by coefficients were mapped to SVM, SGD and LOR, with the intention of assessing the degree of overlap between these methods. Within the top 50 genes by LDA coefficients, three genes within the top 50 coefficients for LOR and SVM were uncovered: NEMP2 (ranked 5th by LDA, 4th by LOR, 10th by SVM), SOX21-AS1 (ranked 8th by LDA and 5th for by LOR and SVM) and RP11-775C24.5 (ranked 34th by LDA, 1st by LOR, 2nd by SVM). However, there was no overlap found between LDA's and SGD's top 50 genes by coefficients. Comparison of XGB's feature importance with the top 50 genes determined by the four other algorithms' coefficients yielded a single match with LDA: C5orf46 (ranked 1st by XGB and 31st by LDA).
Figure 24. Top 50 model coefficients for genes of AD lesional patients with genes mapped to LDA.
3.3.2 AD non-lesional
For the AD non-lesional class, SVM outperformed other algorithms (3.1 Model Performance). Similar to 3.3.1 AD lesional, SVM's top 50 genes by coefficients were mapped to other algorithms: SGD, LOR and LDA. No matches were found within all four algorithm's top 50 gene coefficients. Furthermore, none of XGB's top 50 genes by feature importance were found in any of the other algorithms' top 50 genes. Some consistency was found between SVM's and LOR's top 50 genes coefficients, for example, ASAH1 (ranked 1st by SVM and 47th by LOR) and NET1 (ranked 4th by SVM and 3rdth by LOR). There was only one match between SVM and LDA's top 50 genes by coefficients - LINC01431 (ranked 21st by SVM and 27th by LDA).
Figure 25. Top 50 model coefficients for genes of AD non-lesional patients with genes mapped to SVM.
3.3.3 PSO lesional
Following (3.1 Model Performance), SVM, LOR and LDA were found to perform equally. SVM was selected based on the overall performance of the algorithm with other conditions and the remaining algorithms were mapped to its top 50 genes by coefficients (including SGD). No matches were found between all four algorithms based on their top 50 genes by coefficients. SVM, LOR and LDA had one top 50 gene match: ZBTB11 (ranked 15th by SVM, 4th by LOR, 49th by LDA). SVM and LDA had two matches: LINC01431 (ranked 4th by SVM and 50th by LDA) and SLC6A16 (ranked 36th by SVM and 33th by LDA). SVM and SGD had one match: STYK1 (ranked 7th by SVM and 9th by SGD). There were no other matches found between any of the above mentioned algorithms and XGB.
Figure 26. Top 50 model coefficients for genes of PSO lesional patients with genes mapped to SVM.
3.3.4 PSO non-lesional
For the PSO non-lesional condition, the analysis was based on the SVM algorithm for reasons discussed earlier in (3.1 Model performance and 3.3.3 PSO lesional). For comparison, the same models were used as for previous classes. There were no matches observed across the top 50 genes by coefficients for all models. Two matches were observed between SVM, LOR and LDA: RP11-487I5.4 (ranked 6th by SVM, 12th by LOR, 23rd by LDA) and RP11-332H18.3 (ranked 47th by SVM, 23rd by LOR, 4th by LDA). Additionally there was one match found between LDA's top 50 genes by coefficients and XGB: GPLD1 (ranked 59th by XGB and 29th by LDA).
Figure 27. Top 50 model coefficients for genes of PSO non-lesional patients with genes mapped to SVM.